
MAPEO DE COBERTURAS DE LA TIERRA PARA EL 2017, EN EL OCCIDENTE HONDUREÑO


MAPEO DE COBERTURAS DE LA TIERRA PARA EL 2017, EN EL OCCIDENTE HONDUREÑO SOBRE ÁREAS DE INTERVENCIÓN DE LA ACTIVIDAD GOBERNANZA EN ECOSISTEMAS, MEDIOS DE VIDA Y AGUA (USAID/GEMA)
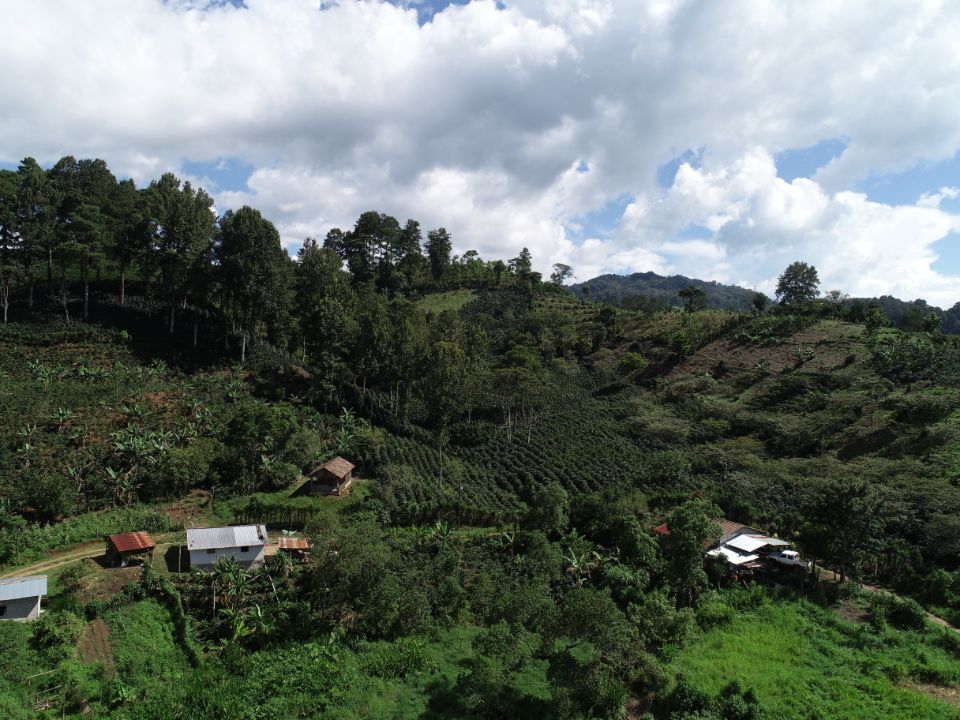
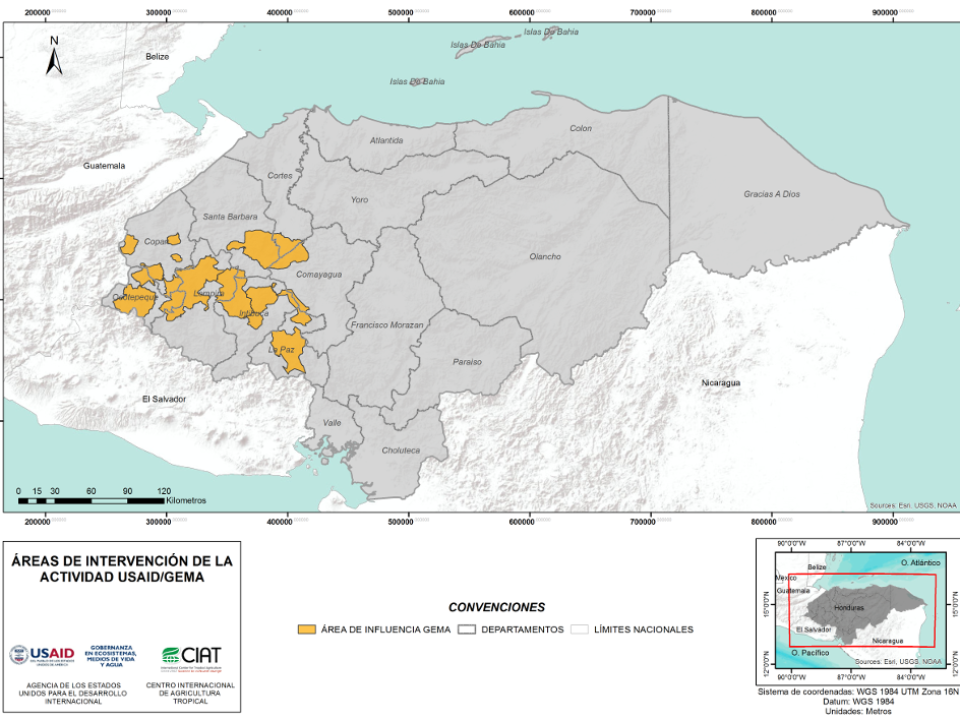
ZONA PILOTO: SANTA ROSA DE COPÁN, MONTAÑA VERDE -OPALACA, MONTECILLOS, MIXCURE, LAGO DE YOJOA, GÜISAYOTE, EL JILGUERO, COCOYAGUA, CELAQUE-PUCA, ANILLO VERDE Y COPÁN RUINAS.
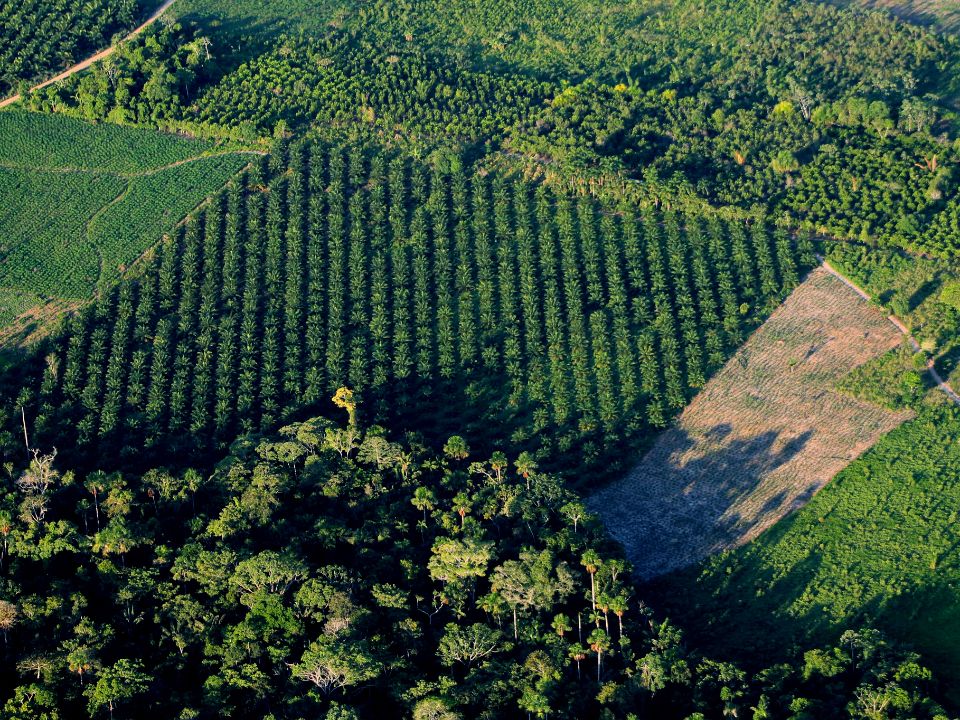
Para el occidente hondureño se ha realizado un mapeo de las coberturas de la tierra 2017 con el fin de contar con información actualizada para el apoyo en la planificación y la toma de decisiones relacionados con la evaluación de los cambios de cobertura en las áreas de intervención de la actividad USAID/GEMA.
El mapeo de las coberturas de la tierra es una herramienta de alta importancia ya que permite estudiar las dinámicas de los elementos naturales y las interacciones antrópicas presentes en el territorio.
En la actualidad Honduras cuenta con un mapa de coberturas de la tierra elaborado por el Instituto de Conservación Forestal (ICF) para el año 2014, elaborado a partir de imágenes Rapideye del 2012-2014 con el fin de tener información actualizada en el occidente hondureño, específicamente las áreas de intervención GEMA dentro de la actividad de USAID, se ha cartografiado la cobertura para el año 2017 a través de imágenes Sentinel-2 (S-2) y métodos de clasificación semi-automatizada.
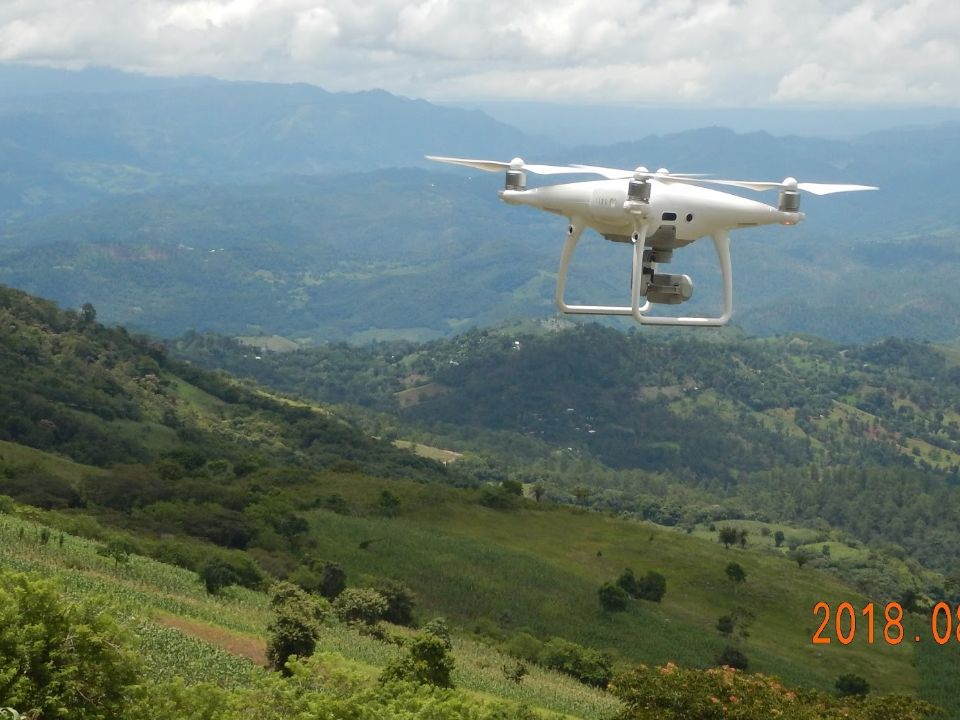
Contar con la información actualizada de las coberturas, permite identificar su relación con temáticas como el cambio climático, la deforestación y la conservación de la biodiversidad. Mapas como el elaborado en las áreas de influencia, a través de Sistemas de Información Geográfica (SIG), imágenes satelitales de alta resolución espacial (10m), fotografías de muy alta resolución espacial capturadas por vehículos aéreos no tripulados y algoritmos semi-automatizados, hacen posible la creación de cartografía actualizada que permite realizar análisis de cambios en las coberturas de alta importancia como los bosques.
Método y resultados:
Sobre las áreas de influencia del proyecto, se realizaron los siguientes pasos para el desarrollo del mapa de coberturas de la tierra 2017:
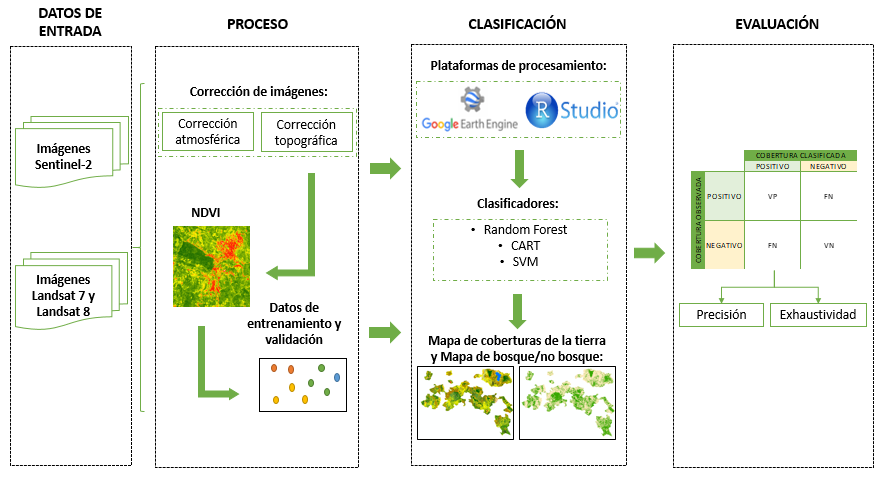
Figura 1. Esquema metodológico
La metodología consistió en utilizar como datos de entrada 3 colecciones imágenes satelitales Sentinel-2 y Landsat 5 y 8 procesadas sobre la plataforma de Google Earth Engine (GEE) en donde se aplica la corrección atmosférica y topográfica para la eliminación de nubes y sombras, además de calcular el NDVI para cada imagen, clasificar las coberturas, y posteriormente evaluar el mapa resultante.
|
Dato clave: Google Earth Engine es una herramienta de procesamiento de datos desarrollada por Google, y en la actualidad es una de las más robustas e importantes, gracias a la velocidad en los procesos, la cantidad de datos disponibles y a los mecanismos de análisis de datos espaciales. |
Sobre GEE, se realiza la clasificación para estimar el tipo de cobertura en las áreas piloto de GEMA, usando mecanismos de aprendizaje automático tales como, Random Forest (RF), Máquina de Soporte Vectorial (SVM) y Árboles de Clasificación y Regresión (CART). Los datos de entrenamiento para alimentar los clasificadores, se capturan a través de las imágenes disponibles en el software Google Earth Pro y se complementan con las imágenes de muy alta resolución suministradas por GeoNetwork para el año 2017 con el apoyo de USAID.
A continuación, se encuentra el marco metodológico detallado para realizar el mapa de coberturas:
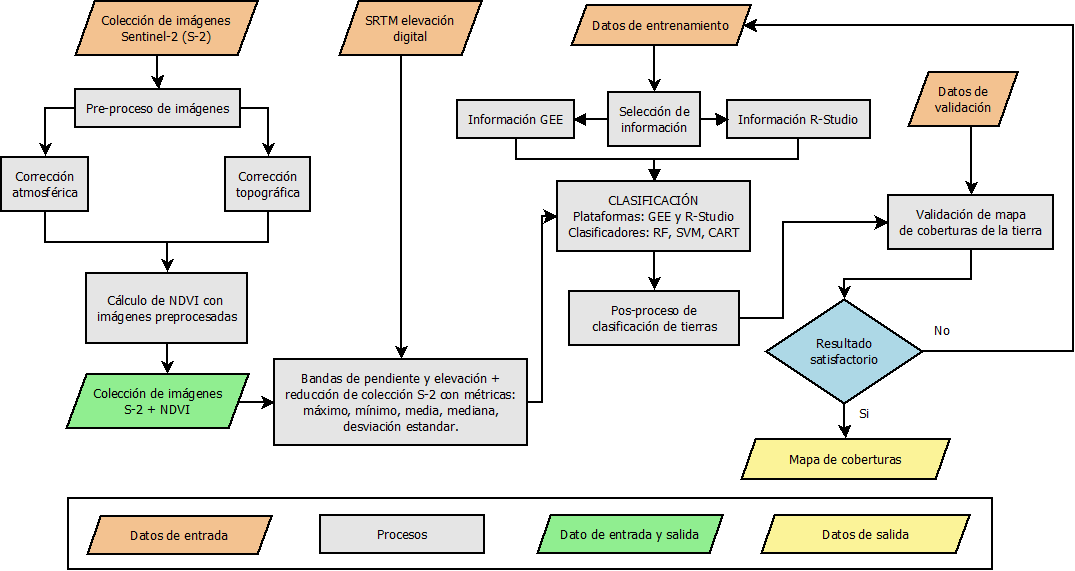
Figura 2. Metodología para elaborar mapa de coberturas en áreas piloto de GEMA
Estas clasificaciones se calibraron a través de imágenes de muy alta resolución, capturadas mediante vehículos aéreos no tripulados, Google Earth, DigitalGlobe, en 104 lugares sobre las áreas de la actividad y de esta forma se obtuvo un resultado satisfactorio, el cual se realizó con el clasificador RF alcanzando una precisión del 95%.
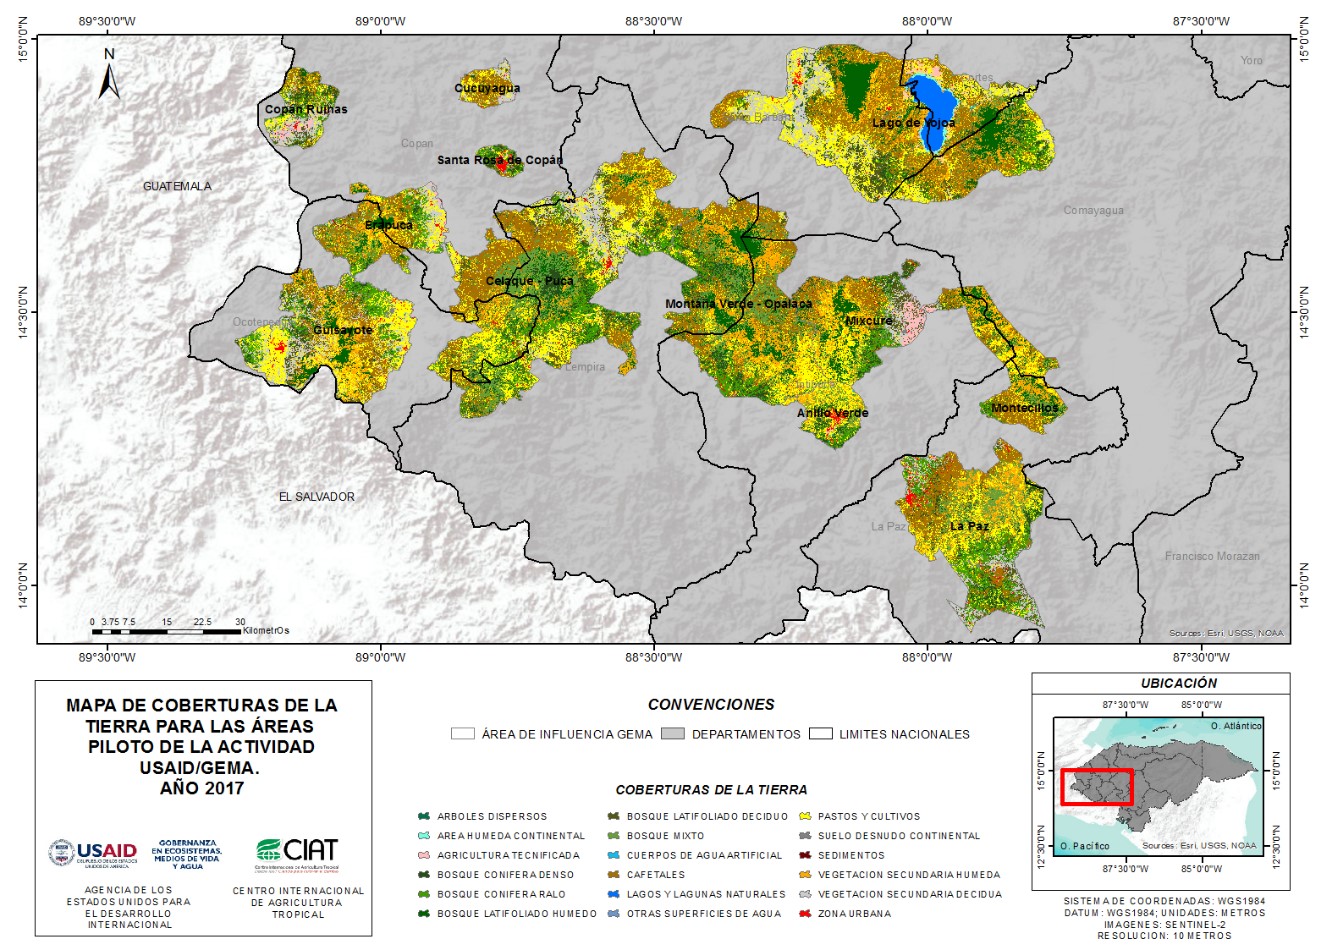
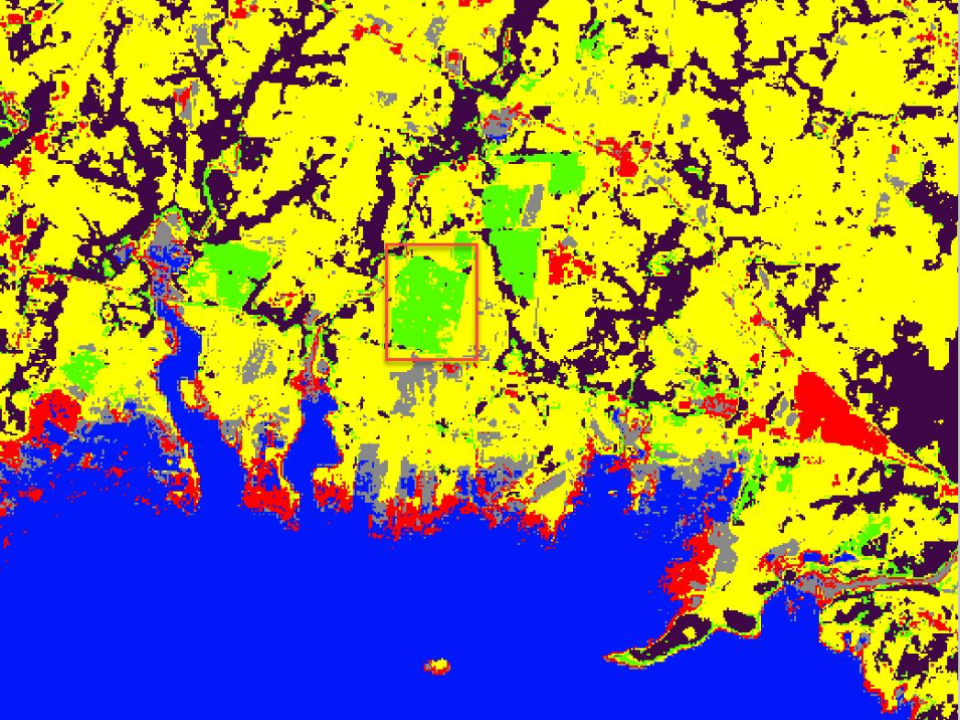
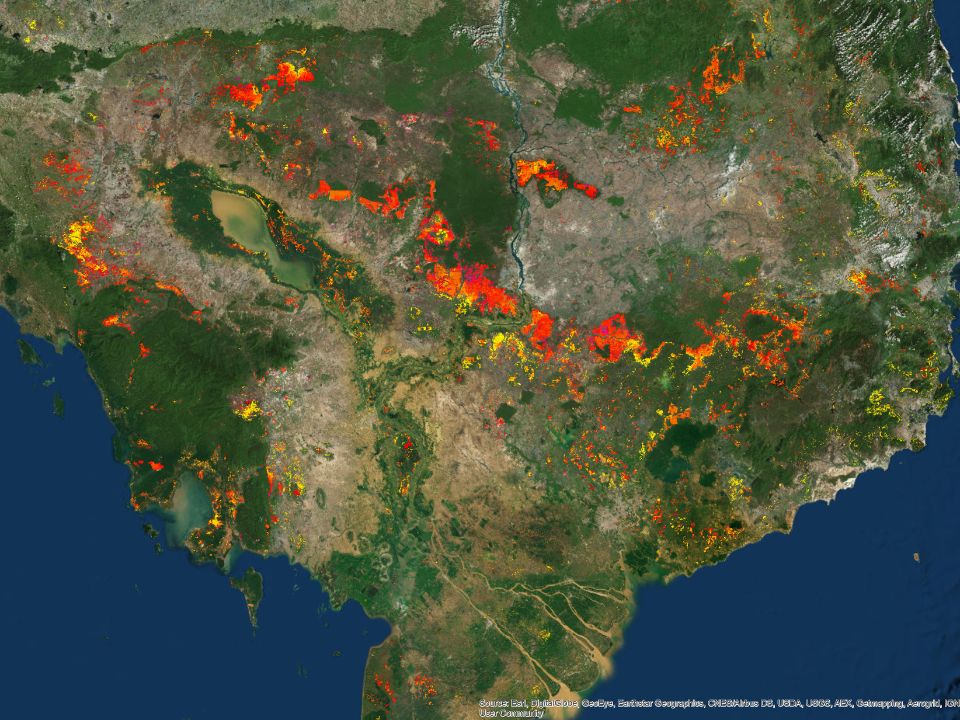
Figura 3. Mapa de coberturas de la tierra para áreas piloto de GEMA.
Para el año 2017, teniendo en cuenta que las áreas GEMA son dominadas por los bosques y la vegetación secundaria, es importante resaltar que el total de su extensión está compuesta por el 36.32% de bosques y el 17% de vegetación secundaria, donde el bosque conífera denso, bosque conífera ralo, bosque latifoliado húmedo, bosque latifoliado deciduo y bosque mixto, ocupan un 6.1%, 9.1%, 7.6%, 4.0% y 9.5% respectivamente; mientras que la vegetación secundaria húmeda ocupa el 10.1%, y la vegetación secundaria decidua el 7.5%. Estos valores reflejan que el 53.9 % de la vegetación en las áreas de influencia de la actividad de USAID, se encuentran entre vegetación secundaria y bosques, pero este último podría aumentar su extensión si se aplican métodos de conservación.
|
Dato clave: Para este tipo de investigaciones en las que se clasifica coberturas de tierra que presentan señales espectrales similares, se recomienda mayor cantidad de datos capturados en campo para lograr calibrar de mejor manera los clasificadores. |
El mapa de coberturas de la tierra fue realizado por el Centro Internacional de Agricultura Tropical (CIAT) en colaboración con la actividad de Gobernanza en Ecosistemas Medios de Vida y Agua de la Agencia de los Estados Unidos para el Desarrollo Internacional, Honduras (USAID-Honduras por sus siglas en inglés) y los Especialistas en Monitoreo Forestal (UMF), Instituto Nacional de Conservación y Desarrollo Forestal, Áreas Protegidas y Vida Silvestre (ICF).
Escrito por: Jorge Andres Perez Escobar, Silvia Elena Castaño & Paula Andrea Paz Garcia


The Terra-i team together with CRS El Salvador under the Raices project carried out a virtual workshop through the teams platform to technicians from the Ministry of Environment and Natural Resources, CARITAS, Universidad El Salvador, CENTA, about the Mapping of land cover using remote sensors and open source tools such as GEE, SEPAL and QGIS- Plugin Semi Automatic Classification.

Near real-time vegetation loss detection in Southwestern Ethiopia: calibration, validation, and implementation of the Terra-i system

The Alliance of Bioversity International and the International Center for Tropical Agriculture (CIAT) (the Alliance) conducted a training for local stakeholders on the use of Terra-i as part of the collaboration with the Netherlands Development Organisation – SNV in the Coffee Agroforestry and Forest Enhancement for REDD+ (CAFÉ-REDD) Project.


IDENTIFICACIÓN DE CAUSAS DE PÉRDIDA DE COBERTURA VEGETAL EN LAS ÁREAS DE INTERVENCIÓN DE LA ACTIVIDAD GOBERNANZA EN ECOSISTEMAS, MEDIOS DE VIDA Y AGUA (USAID/GEMA) EN EL OCCIDENTE DE HONDURAS

CUANTIFICACIÓN DE LA DEFORESTACIÓN EN LAS ÁREAS DE INTERVENCIÓN DE LA ACTIVIDAD GOBERNANZA EN ECOSISTEMAS, MEDIOS DE VIDA Y AGUA (USAID/GEMA) EN EL OCCIDENTE DE HONDURAS

An international team of scientists*, involving entomologists, conservation biologists, agro-ecologists and geographers, has just revealed how on-farm insect biological control can slow the pace of tropical deforestation and avert biodiversity loss on a macro-scale. The case study concerns biological control of the invasive mealybug Phenacoccus manihoti with the introduced host-specific parasitic wasp Anagyrus lopezi in Southeast Asia. The results of this study have just been published in Communications Biology – Nature.
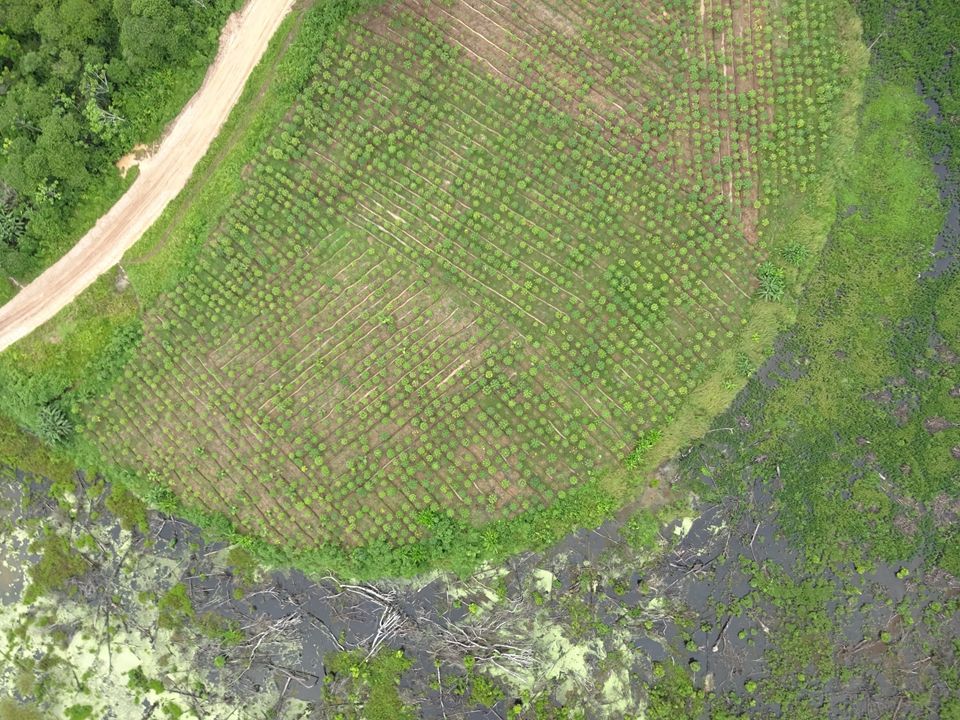

From May 8-12, 2017, the Terra-i team, together with staff from the DGOTA of Peru's Ministry of Environment, carried out the first field validation of vegetative land cover changes detected during Terra-i monitoring for 2016 and 2017, using the technology UAV. This work was carried out under the framework of the project “Sustainable Amazonian Landscapes”. The team carried out over-flights with a Phantom 3 advanced rotor drone and a fixed-wing Ebee drone in seven townships of Yurimaguas. The objective of this work was to recognize the dynamics of land cover and land use changes in the region while at the same time to validate the accuracy of the detections of forest loss being monitored by Terra-i in Yurimaguas.

CIAT and the Terra-i team are pleased to announce the publication of a new study in Paraquaria Natural, the most prestigious journal in Paraguay dedicated to biodiversity and the conservation of nature.


The Terra-i team has worked hard on renovating Terra-i’s website since early this year. A set of new features on the website provides interactive contents and facilitates adaptation to the mobile devices of our users. The fresh website was developed using the latest update of an open-source, Java-based web system, Magnolia CMS 5.4.4. This update was customized to add different categories of interaction such as news, vegetation cover changes, and information, among others.

Globally more than 1 billion people depend on forests for their livelihoods. Forests play a crucial role in climate regulation, ecosystem services provision and regulation, water supply, carbon storage and many other functions that support biodiversity. Currently the global rate of deforestation is substantial, and there is a growing need for timely, spatially explicit data that flag natural vegetation changes due to human activities.

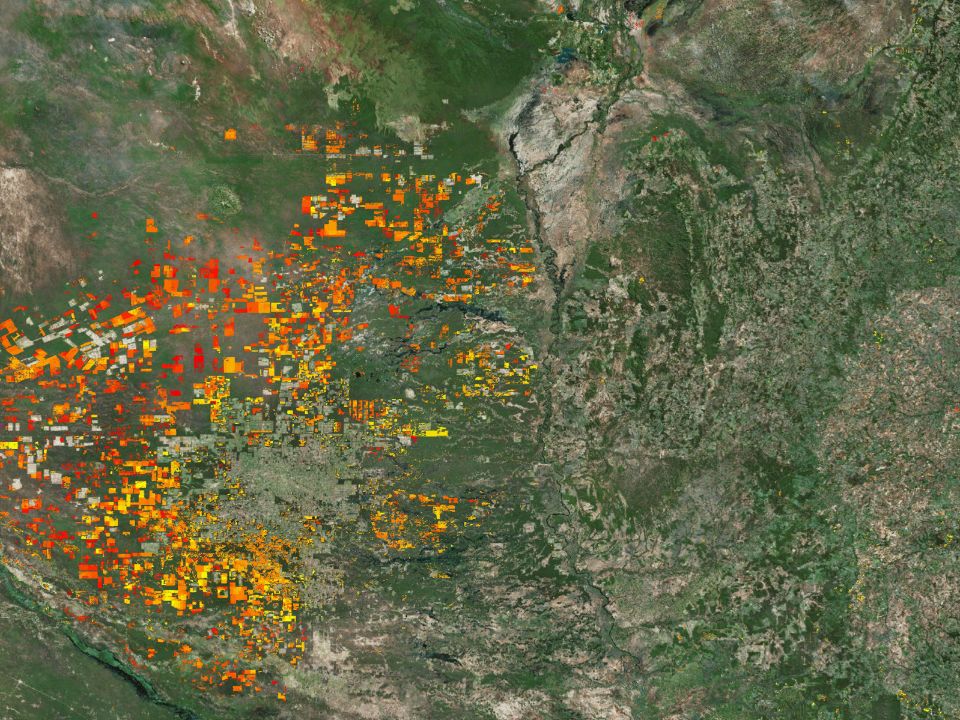
New deforestation hotspots point the finger at my favourite fruit I love Terra-i, but today I hate it. A lot. The system uses satellite images to track deforestation in the Amazon in near-realtime. It’s extremely accurate: if a bunch of trees come down somewhere – no matter how remote – Terra-i picks it up. Cool, right? Not today. CIAT’s Louis Reymondin, the system’s chief architect, dropped the bombshell over coffee: it looks as though hundreds of hectares of rainforest in Peru are being trashed by… papaya.

The latest update of Terra-i has been used with the Co$ting Nature ecosystem services assessment tool to understand the impacts of recent forest loss in Colombia on biodiversity and ecosystem services.

The production of geospatial data related to land-use and land cover changes by governments and civil society organizations has vastly increased during the last decade. Going beyond the valuable information (location, rates and absolute values of changes) provided by these datasets, it is important to have a better understanding of the spatial configurations and composition of the detected change areas at multiple spatial resolutions and time periods. Alejandro Coca-Castro’s research is aiming to map types of spatial deforestation patterns in the Amazon rainforest through the integration of landscape fragmentation metrics and data mining techniques. The research will contribute to the understanding of two deforestation datasets (Terra-i and GFC) and is part of his master dissertation at King’s College London. This blog post highlights Alejandro’s research methodology, preliminary findings and challenges.

Ecuador is recognized as one of the biodiverse hotspots on earth, underneath the Amazon rainforest lies the country’s oil reservoir. With the oil companies and cleared routes come settlers, therefore more and more of this diverse rainforest is being cut down. Since the oil concerns entered the Ecuadorian Amazon 45 years ago, they keep exploring and exploiting the area. The Terra-i detections reveal a total habitat loss of 87,525 Ha, 16,943 Ha (19%) is part of protected areas, between January 2004 and February 2015.
IDENTIFICACIÓN DE CAUSAS DE PÉRDIDA DE COBERTURA VEGETAL EN LAS ÁREAS DE INTERVENCIÓN DE LA ACTIVIDAD GOBERNANZA EN ECOSISTEMAS, MEDIOS DE VIDA Y AGUA (USAID/GEMA) EN EL OCCIDENTE DE HONDURAS
CUANTIFICACIÓN DE LA DEFORESTACIÓN EN LAS ÁREAS DE INTERVENCIÓN DE LA ACTIVIDAD GOBERNANZA EN ECOSISTEMAS, MEDIOS DE VIDA Y AGUA (USAID/GEMA) EN EL OCCIDENTE DE HONDURAS
An international team of scientists*, involving entomologists, conservation biologists, agro-ecologists and geographers, has just revealed how on-farm insect biological control can slow the pace of tropical deforestation and avert biodiversity loss on a macro-scale. The case study concerns biological control of the invasive mealybug Phenacoccus manihoti with the introduced host-specific parasitic wasp Anagyrus lopezi in Southeast Asia. The results of this study have just been published in Communications Biology – Nature.
CIAT and the Terra-i team are pleased to announce the publication of a new study in Paraquaria Natural, the most prestigious journal in Paraguay dedicated to biodiversity and the conservation of nature.
New deforestation hotspots point the finger at my favourite fruit I love Terra-i, but today I hate it. A lot. The system uses satellite images to track deforestation in the Amazon in near-realtime. It’s extremely accurate: if a bunch of trees come down somewhere – no matter how remote – Terra-i picks it up. Cool, right? Not today. CIAT’s Louis Reymondin, the system’s chief architect, dropped the bombshell over coffee: it looks as though hundreds of hectares of rainforest in Peru are being trashed by… papaya.
The production of geospatial data related to land-use and land cover changes by governments and civil society organizations has vastly increased during the last decade. Going beyond the valuable information (location, rates and absolute values of changes) provided by these datasets, it is important to have a better understanding of the spatial configurations and composition of the detected change areas at multiple spatial resolutions and time periods. Alejandro Coca-Castro’s research is aiming to map types of spatial deforestation patterns in the Amazon rainforest through the integration of landscape fragmentation metrics and data mining techniques. The research will contribute to the understanding of two deforestation datasets (Terra-i and GFC) and is part of his master dissertation at King’s College London. This blog post highlights Alejandro’s research methodology, preliminary findings and challenges.
Ecuador is recognized as one of the biodiverse hotspots on earth, underneath the Amazon rainforest lies the country’s oil reservoir. With the oil companies and cleared routes come settlers, therefore more and more of this diverse rainforest is being cut down. Since the oil concerns entered the Ecuadorian Amazon 45 years ago, they keep exploring and exploiting the area. The Terra-i detections reveal a total habitat loss of 87,525 Ha, 16,943 Ha (19%) is part of protected areas, between January 2004 and February 2015.