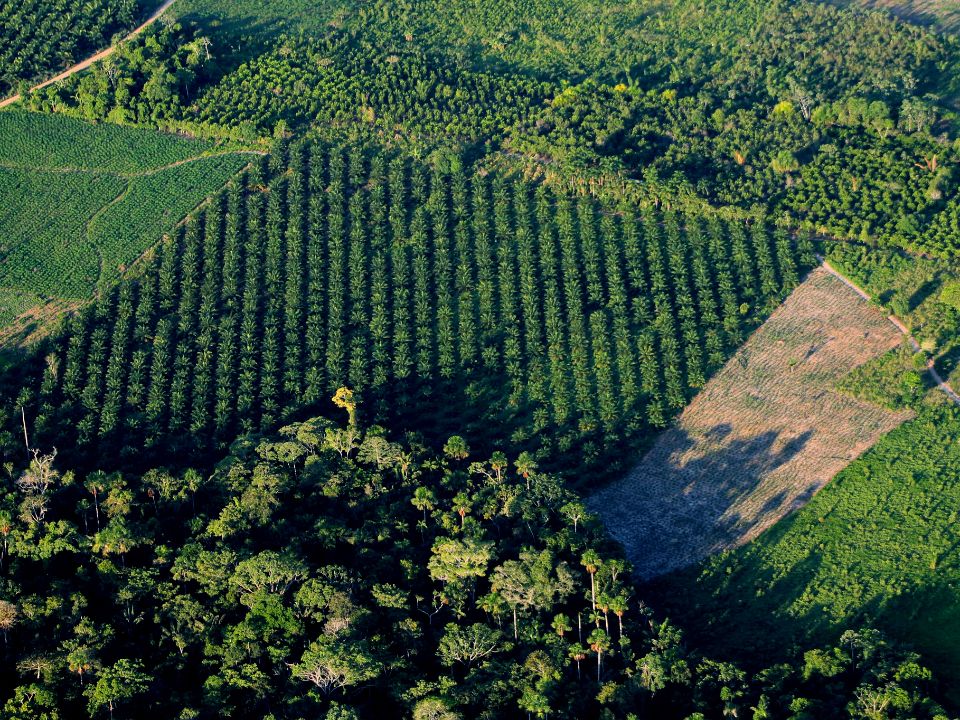

How can the shapes and distribution of deforested areas inform us about the agents of changes on the ground?


The production of geospatial data related to land-use and land cover changes by governments and civil society organizations has vastly increased during the last decade. Going beyond the valuable information (location, rates and absolute values of changes) provided by these datasets, it is important to have a better understanding of the spatial configurations and composition of the detected change areas at multiple spatial resolutions and time periods. Alejandro Coca-Castro’s research is aiming to map types of spatial deforestation patterns in the Amazon rainforest through the integration of landscape fragmentation metrics and data mining techniques. The research will contribute to the understanding of two deforestation datasets (Terra-i and GFC) and is part of his master dissertation at King’s College London. This blog post highlights Alejandro’s research methodology, preliminary findings and challenges.
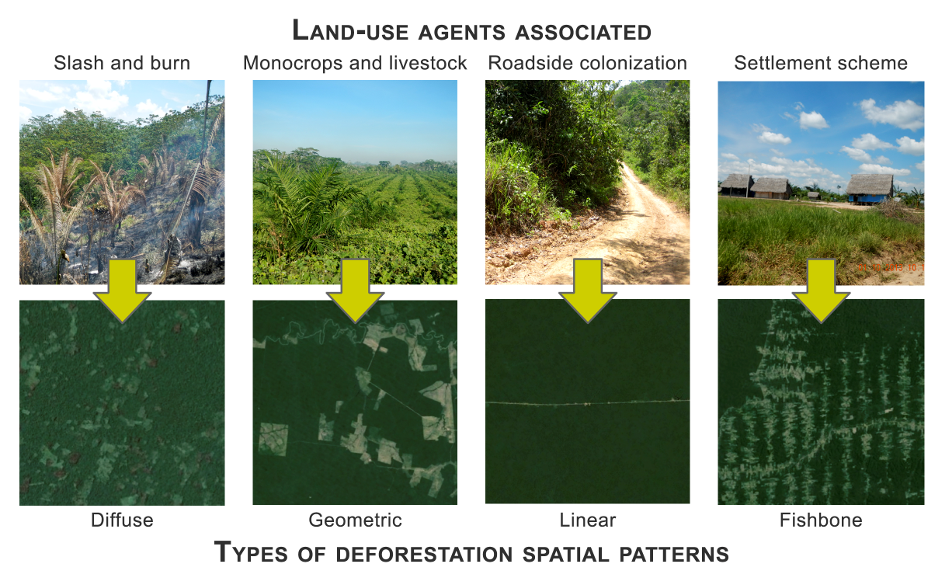
Figure 1. Relationships between four types of deforestation spatial patterns, visually differentiated using Google Earth Imagery, and related land-use agents. Photos provided by the Terra-i project.
A first look: relevance of deforestation spatial patterns research
Google Maps can clearly introduce us to what the spatial configurations of land cover are. Zooming in to a particular forested region like the Amazon allows us to visualise differences in the shapes (composition) and distribution (configuration) between deforested areas (Figure 1). These structural types of deforestation, commonly referred to as “deforestation spatial patterns”, may be linked with known land-use processes and agents that promote forest disturbances at the ground. In this way, the identification and mapping of types of deforestation patterns is key to providing multi-level, flexible information of use to forest conservation groups, land managers and related practitioners. Moreover, knowledge on the spatial configuration and composition of deforestation patterns assists in the modelling of future land-use scenarios.
Methodology: what’s new?
Several techniques have been developed to facilitate the understanding of deforested elements and their dynamics in landscapes (Figure 2). Of these methods, window analysis, has been widely used not only to characterise the spatial configuration and composition of deforested areas, but also to determine the agents associated with them: small-scale farmers, large plantations, or cattle ranchers, among others. The characterisation of spatial pattern typologies using window analysis has been strongly supported by the development of specialised software for assessing landscape fragmentation, such as the FRAGSTATS analysis package. This software has helped to strengthen the analysis of landscape structure using landscape pattern indices called “landscape metrics”.
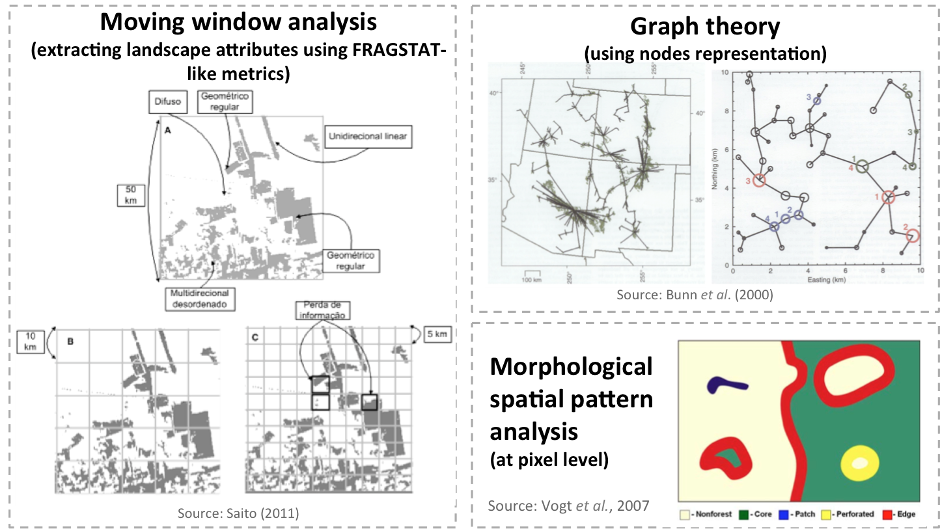
Figure 2. Some examples of methodologies for analysing spatial patterns and elements of deforested areas. Refer to the sources provided for further information on these methodologies.
The workflow behind the window analysis approach is a type of “Knowledge discovery in databases” (KDD) process (Figure 3). KDD includes multidisciplinary activities that aim to develop new information from existing databases, and its major application areas are in marketing, fraud detection, telecommunication and manufacturing. KDD encompasses data storage and access, algorithm scaling (data mining) for application to massive data sets and results interpretation.
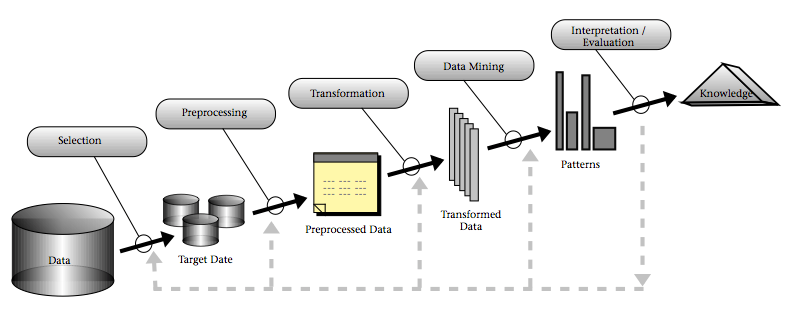
Figure 3. An overview of the steps in the KDD Process. Source: Fayyad et al. (1996).
In the case of pattern analysis research, input data basically consist of a set of landscape fragmentation properties (landscape metrics) that can be extracted from the deforested elements using a known window size to create a grid. After data extraction and preprocessing, a range of data mining algorithms for classification can be used; however, the vast majority of pattern analyses have been supported by the use of decision trees. Alejandro’s research focuses on the implementation of feed-forward artificial neural networks that tend to be more robust than decision trees. Artificial neural networks improve their performance by ‘learning,’ a process that may continue even after the training set has been analysed. Some disadvantages of artificial neural networks are the difficulties in explaining their workings to end users (unlike decision trees, which are easy to understand), overfitting, or failing to converge in the learning phase (they do not guarantee convergence or optimality), among others.
Enhancing the robustness of deforestation pattern analysis research
The perfect algorithm for a KDD project does not exist; it depends on the problem context and database features. Alejandro’s research has identified the following steps as key to enhance the robustness of the KDD process for mapping deforestation spatial patterns:
Preprocessing the input data to avoid missing values and noise, reduce of data dimensions (e.g. PCA analysis) and/or remove highly correlated or redundant variables;
Using bagging or cross-validation techniques to train artificial neural network models and reduce overfit;
Tuning and testing a range of values over the main artificial neural network parameters such as the number of hidden layers and weight decay;
Selecting the best artificial neural network models according to robust classifier performance metrics such as the Area Under the Receiver Operating Characteristic curve (AUC-ROC), which is not influenced by the costs of misclassification;
Plotting the structure of the selected artificial neural network model in a friendly format that includes the relative importance of different variables so as to explain to end users what could be behind “the black box”.
Preliminary results
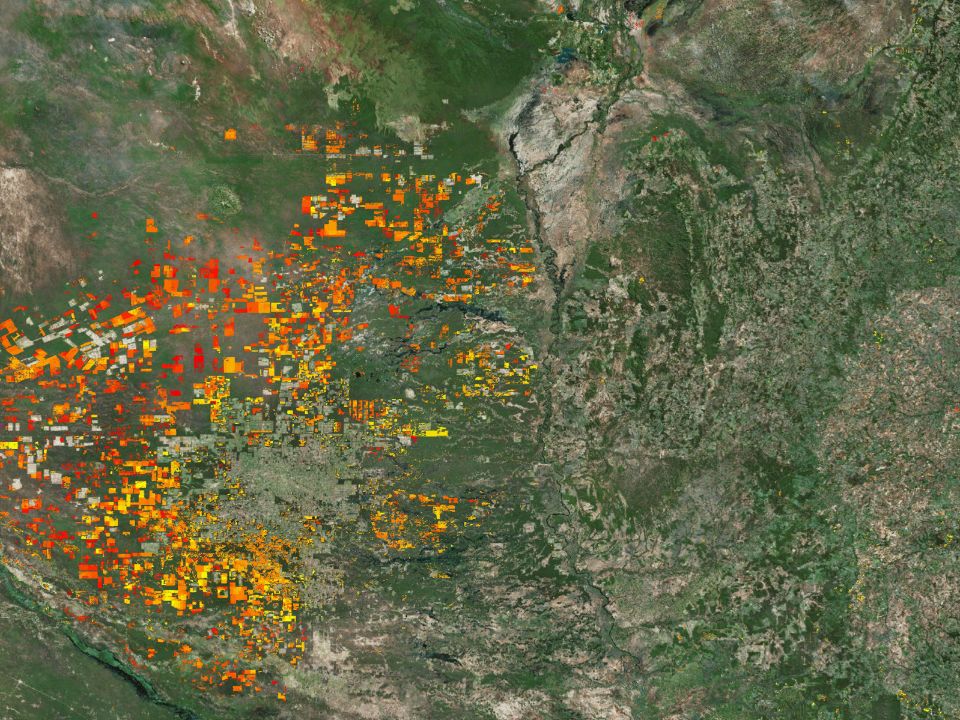
A KDD project implemented in a pilot area (approximately 403,200 sq. kilometers) in Brazil showed how powerful artificial neural networks can be for classifying five types of deforestation patterns (four of which are illustrated in Figure 1). Using a window size of approximately 30 km by 30 km, a training set was randomly created, selecting 15 representative grids (samples) by pattern (Figure 4). From this validation set, 5 samples were used to train the model and the remaining 10 samples were used to test and assess the model’s performance. The input data consisted of approximately 113 input variables (FRAGSTAT-like metrics at patch, class and landscape level in grids extracted from 2004-2012 aggregated detections of the Terra-i dataset). In regard to artificial neural network structure, a set of values was defined for three parameters: the number of neurons (2 to 40 with an increment of 5) in the hidden layer, the penalization parameter associated with the weight decay (0.2 to 0.5 with an increment of 0.1) and the activation function (linear, entropy or censored).
As result of the iterative KDD process, 423 unlabelled grids were automatically classified (Figure 4) with a reported AUC value of 0.65 for the Terra-i dataset. Although the results were promising in the pilot area, a set of challenges (see next section) will likely be encountered when applying the method to a larger area, where the robustness of the methodology workflow needs to be tested and assessed.
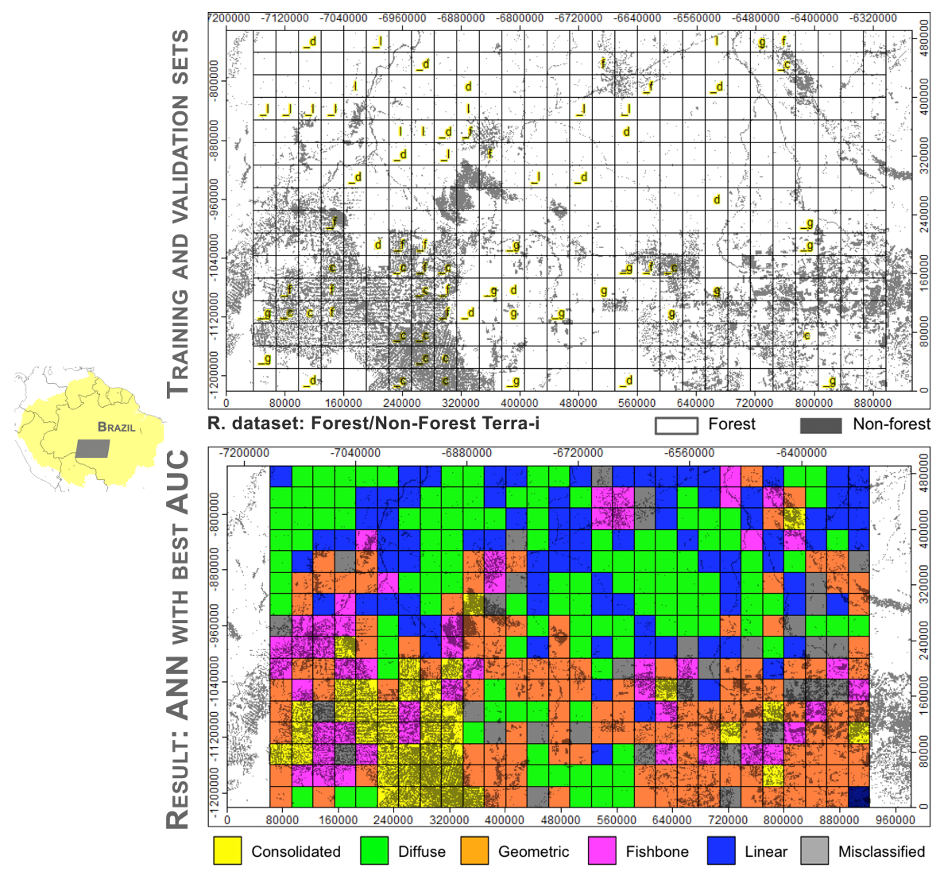
Figure 4. Training and validation sets (top) and results (bottom) of the artificial neural network structure that provided the best AUC value for the classification of five types of deforestation patterns: consolidated (c), diffuse (d), fishbone (f), geometric (g) and linear (l). Underscore indicates validation set.
Challenges
Although there are many challenges to this approach from both the geospatial (management and preprocessing of large spatial datasets) and computational (database manipulation and parallel processing) perspectives, the most relevant from the research perspective are:
Assessing the influence of spatial resolution from the two deforestation datasets (Terra-i and GFC with 250m and 30m, respectively) in the final classification results;
Identifying and comparing the deforestation spatial patterns by five increasing window sizes (8, 15, 30, 60 and 120 km);
Defining optimal artificial neural network models from input variables that have ecological importance so as to reduce the number of inputs tested in the pilot area (more than a hundred to less than 30);
Using the optimal artificial neural network models to determine the temporal dynamics (by three-year intervals) of the types of deforestation spatial patterns by window size.
This research is supported by the usage of software such as ArcInfo and R, which provide a broad set of libraries for spatial analysis and database management. The former is being used to perform vector and raster operations (masking datasets with the target region and creating the forest/non-forest maps) as well as producing cartographical outputs. The latter allows for extracting the FRAGSTAT-like metrics and performing data mining processes using the caret R-package.
Alejandro is grateful to Mark Mulligan (dissertation supervisor at King’s) and the Terra-i team for their support, especially in the optimisation of technical and research aspects of this work.

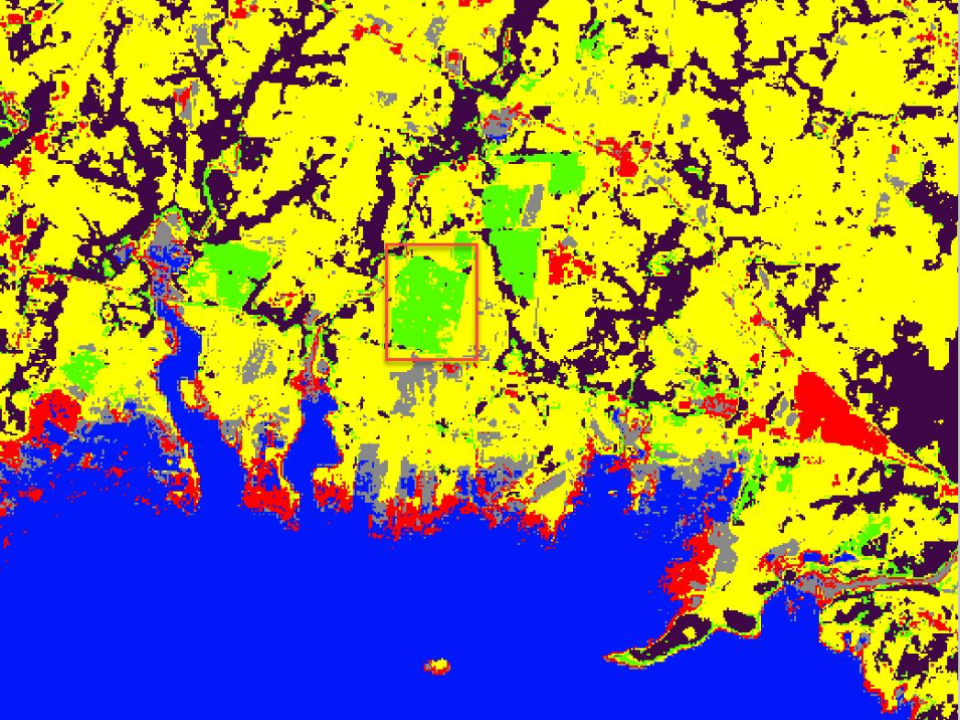
IDENTIFICACIÓN DE CAUSAS DE PÉRDIDA DE COBERTURA VEGETAL EN LAS ÁREAS DE INTERVENCIÓN DE LA ACTIVIDAD GOBERNANZA EN ECOSISTEMAS, MEDIOS DE VIDA Y AGUA (USAID/GEMA) EN EL OCCIDENTE DE HONDURAS

MAPEO DE COBERTURAS DE LA TIERRA PARA EL 2017, EN EL OCCIDENTE HONDUREÑO SOBRE ÁREAS DE INTERVENCIÓN DE LA ACTIVIDAD GOBERNANZA EN ECOSISTEMAS, MEDIOS DE VIDA Y AGUA (USAID/GEMA)
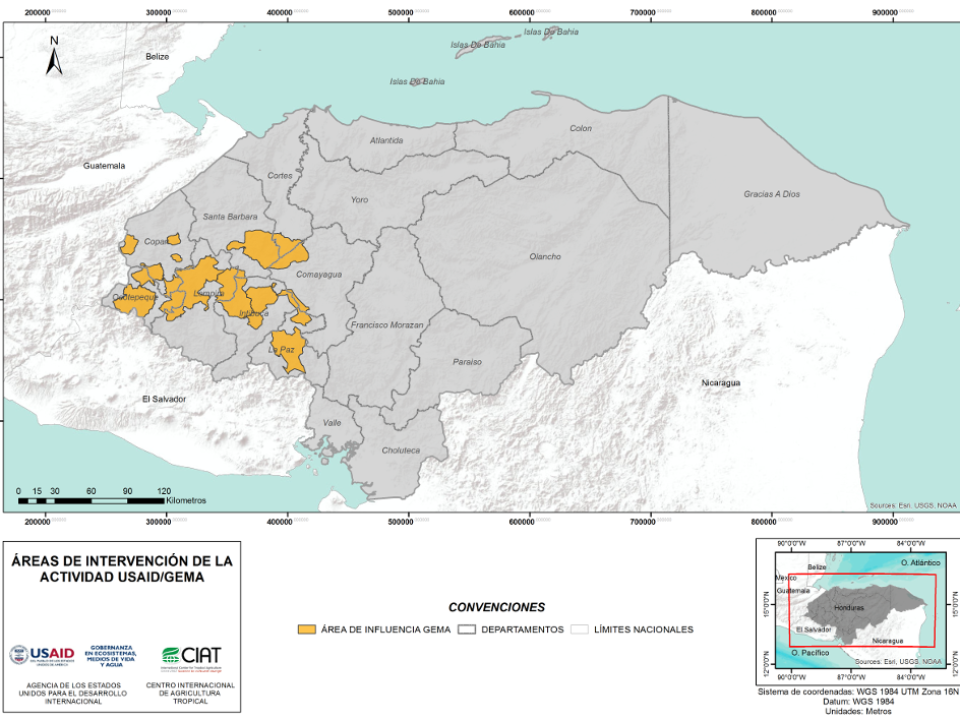

CUANTIFICACIÓN DE LA DEFORESTACIÓN EN LAS ÁREAS DE INTERVENCIÓN DE LA ACTIVIDAD GOBERNANZA EN ECOSISTEMAS, MEDIOS DE VIDA Y AGUA (USAID/GEMA) EN EL OCCIDENTE DE HONDURAS
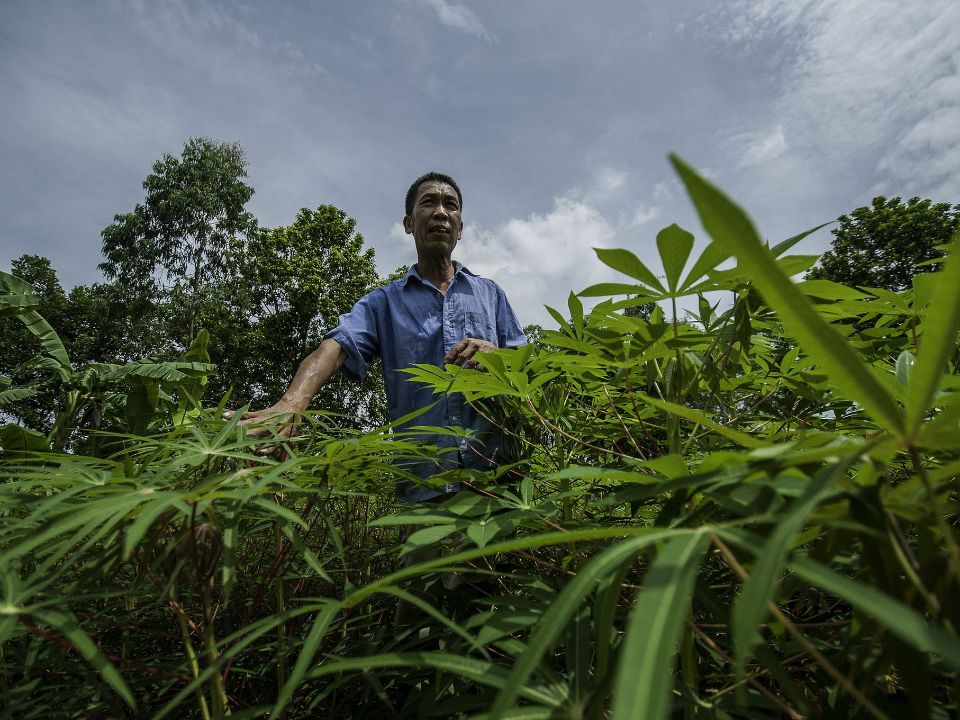

An international team of scientists*, involving entomologists, conservation biologists, agro-ecologists and geographers, has just revealed how on-farm insect biological control can slow the pace of tropical deforestation and avert biodiversity loss on a macro-scale. The case study concerns biological control of the invasive mealybug Phenacoccus manihoti with the introduced host-specific parasitic wasp Anagyrus lopezi in Southeast Asia. The results of this study have just been published in Communications Biology – Nature.

CIAT and the Terra-i team are pleased to announce the publication of a new study in Paraquaria Natural, the most prestigious journal in Paraguay dedicated to biodiversity and the conservation of nature.
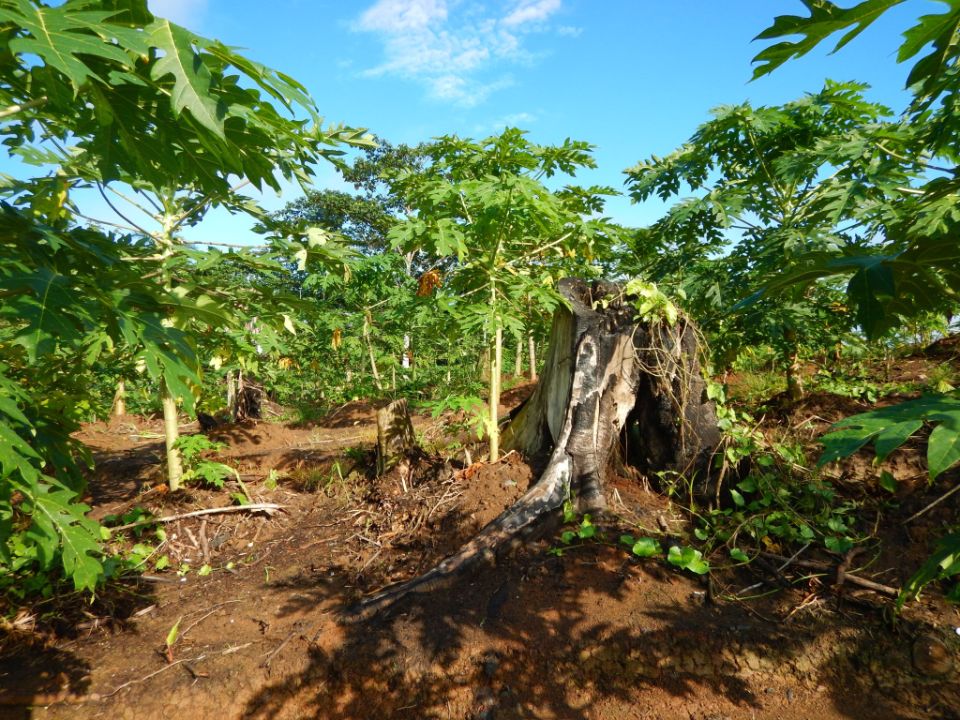

New deforestation hotspots point the finger at my favourite fruit I love Terra-i, but today I hate it. A lot. The system uses satellite images to track deforestation in the Amazon in near-realtime. It’s extremely accurate: if a bunch of trees come down somewhere – no matter how remote – Terra-i picks it up. Cool, right? Not today. CIAT’s Louis Reymondin, the system’s chief architect, dropped the bombshell over coffee: it looks as though hundreds of hectares of rainforest in Peru are being trashed by… papaya.
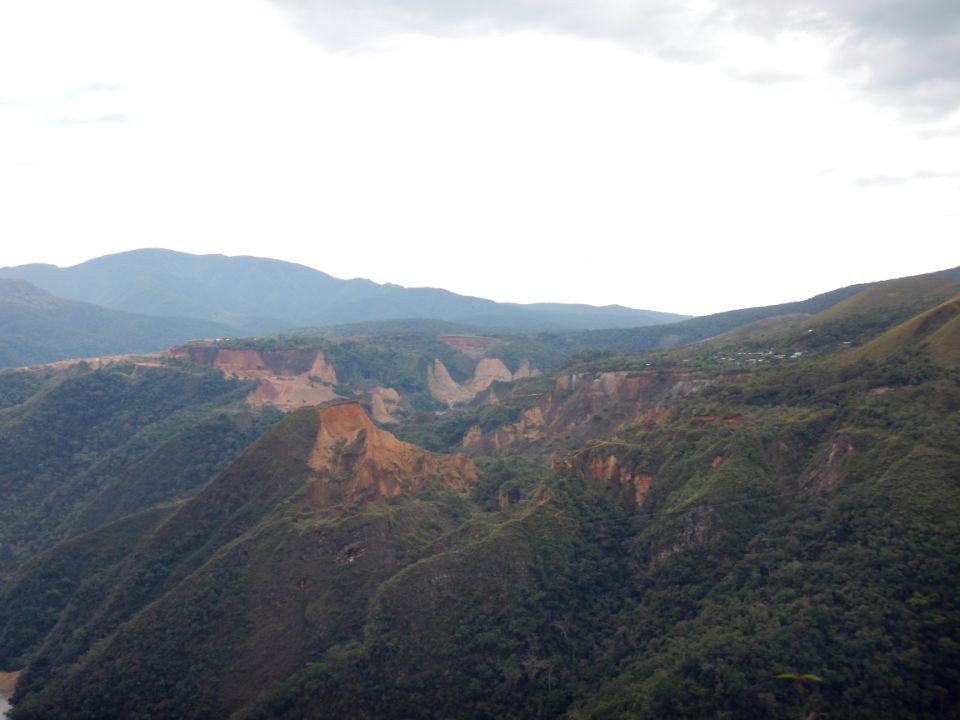

Ecuador is recognized as one of the biodiverse hotspots on earth, underneath the Amazon rainforest lies the country’s oil reservoir. With the oil companies and cleared routes come settlers, therefore more and more of this diverse rainforest is being cut down. Since the oil concerns entered the Ecuadorian Amazon 45 years ago, they keep exploring and exploiting the area. The Terra-i detections reveal a total habitat loss of 87,525 Ha, 16,943 Ha (19%) is part of protected areas, between January 2004 and February 2015.


The Terra-i team together with CRS El Salvador under the Raices project carried out a virtual workshop through the teams platform to technicians from the Ministry of Environment and Natural Resources, CARITAS, Universidad El Salvador, CENTA, about the Mapping of land cover using remote sensors and open source tools such as GEE, SEPAL and QGIS- Plugin Semi Automatic Classification.
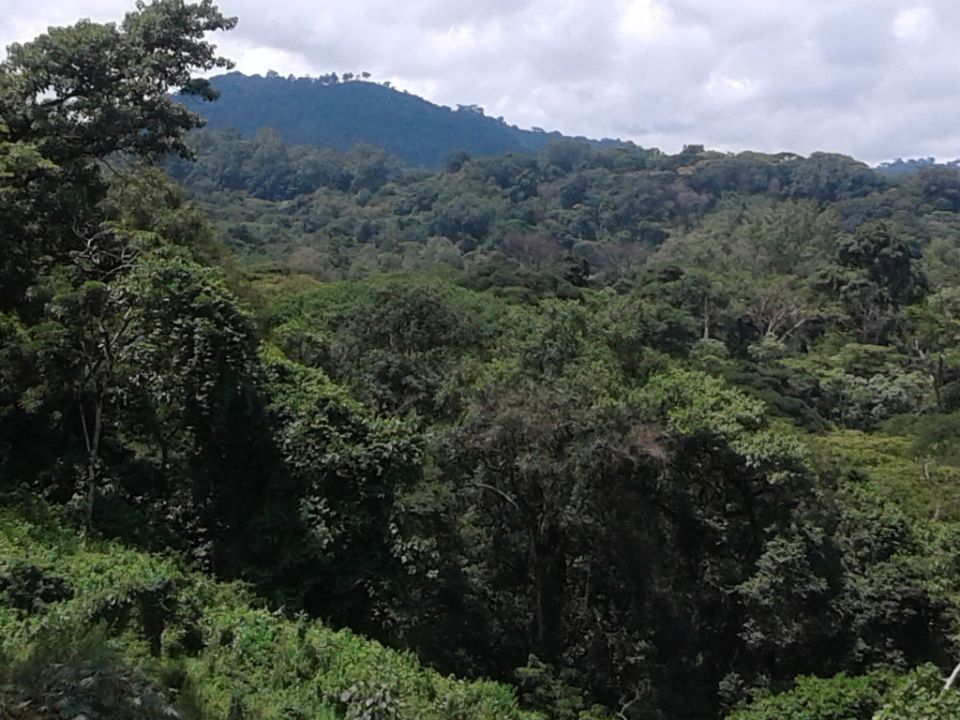

Near real-time vegetation loss detection in Southwestern Ethiopia: calibration, validation, and implementation of the Terra-i system


The Alliance of Bioversity International and the International Center for Tropical Agriculture (CIAT) (the Alliance) conducted a training for local stakeholders on the use of Terra-i as part of the collaboration with the Netherlands Development Organisation – SNV in the Coffee Agroforestry and Forest Enhancement for REDD+ (CAFÉ-REDD) Project.

IDENTIFICACIÓN DE CAUSAS DE PÉRDIDA DE COBERTURA VEGETAL EN LAS ÁREAS DE INTERVENCIÓN DE LA ACTIVIDAD GOBERNANZA EN ECOSISTEMAS, MEDIOS DE VIDA Y AGUA (USAID/GEMA) EN EL OCCIDENTE DE HONDURAS
MAPEO DE COBERTURAS DE LA TIERRA PARA EL 2017, EN EL OCCIDENTE HONDUREÑO SOBRE ÁREAS DE INTERVENCIÓN DE LA ACTIVIDAD GOBERNANZA EN ECOSISTEMAS, MEDIOS DE VIDA Y AGUA (USAID/GEMA)
CUANTIFICACIÓN DE LA DEFORESTACIÓN EN LAS ÁREAS DE INTERVENCIÓN DE LA ACTIVIDAD GOBERNANZA EN ECOSISTEMAS, MEDIOS DE VIDA Y AGUA (USAID/GEMA) EN EL OCCIDENTE DE HONDURAS
An international team of scientists*, involving entomologists, conservation biologists, agro-ecologists and geographers, has just revealed how on-farm insect biological control can slow the pace of tropical deforestation and avert biodiversity loss on a macro-scale. The case study concerns biological control of the invasive mealybug Phenacoccus manihoti with the introduced host-specific parasitic wasp Anagyrus lopezi in Southeast Asia. The results of this study have just been published in Communications Biology – Nature.
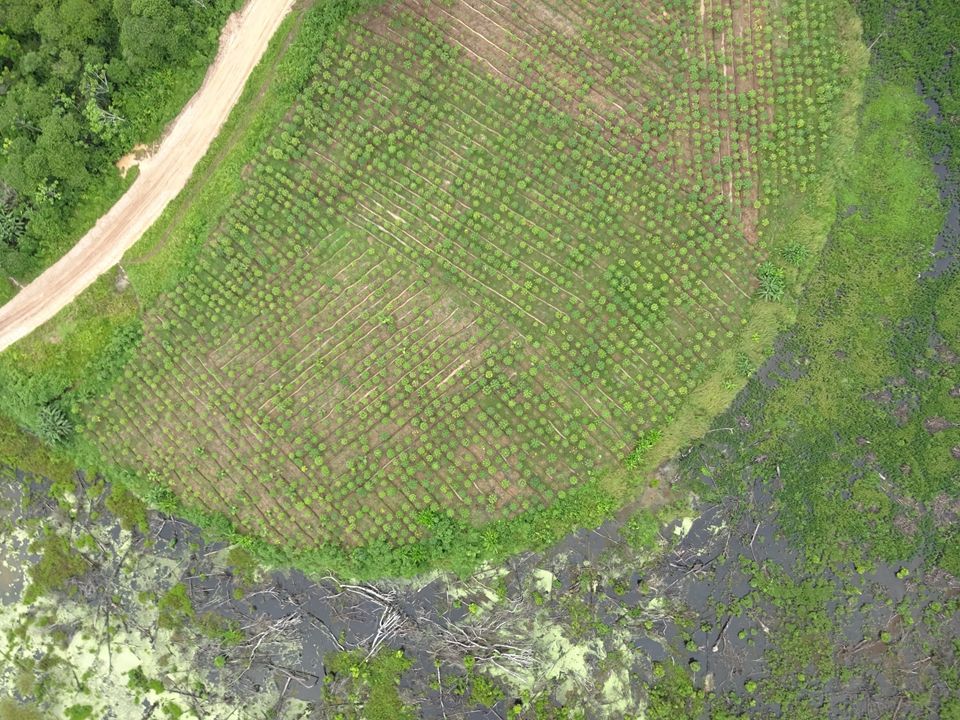

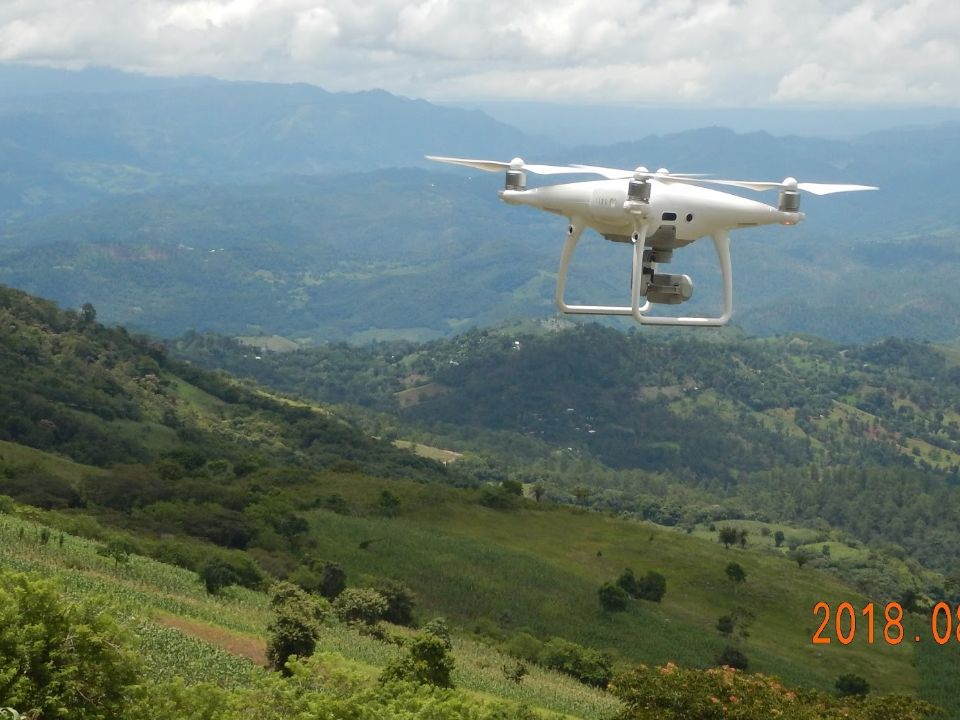
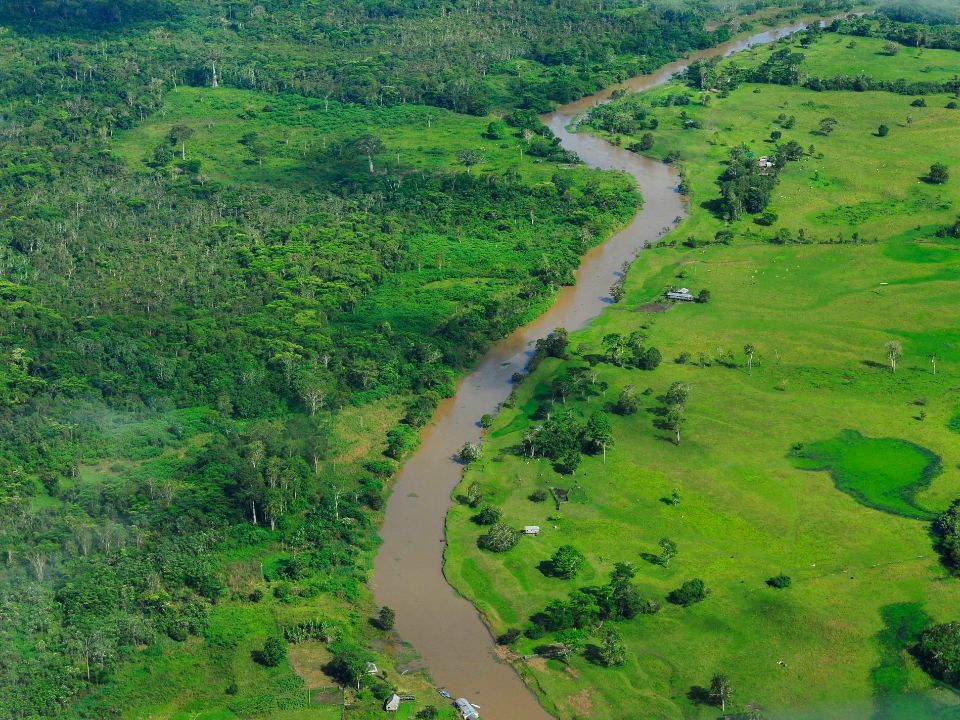
From May 8-12, 2017, the Terra-i team, together with staff from the DGOTA of Peru's Ministry of Environment, carried out the first field validation of vegetative land cover changes detected during Terra-i monitoring for 2016 and 2017, using the technology UAV. This work was carried out under the framework of the project “Sustainable Amazonian Landscapes”. The team carried out over-flights with a Phantom 3 advanced rotor drone and a fixed-wing Ebee drone in seven townships of Yurimaguas. The objective of this work was to recognize the dynamics of land cover and land use changes in the region while at the same time to validate the accuracy of the detections of forest loss being monitored by Terra-i in Yurimaguas.
CIAT and the Terra-i team are pleased to announce the publication of a new study in Paraquaria Natural, the most prestigious journal in Paraguay dedicated to biodiversity and the conservation of nature.


The Terra-i team has worked hard on renovating Terra-i’s website since early this year. A set of new features on the website provides interactive contents and facilitates adaptation to the mobile devices of our users. The fresh website was developed using the latest update of an open-source, Java-based web system, Magnolia CMS 5.4.4. This update was customized to add different categories of interaction such as news, vegetation cover changes, and information, among others.
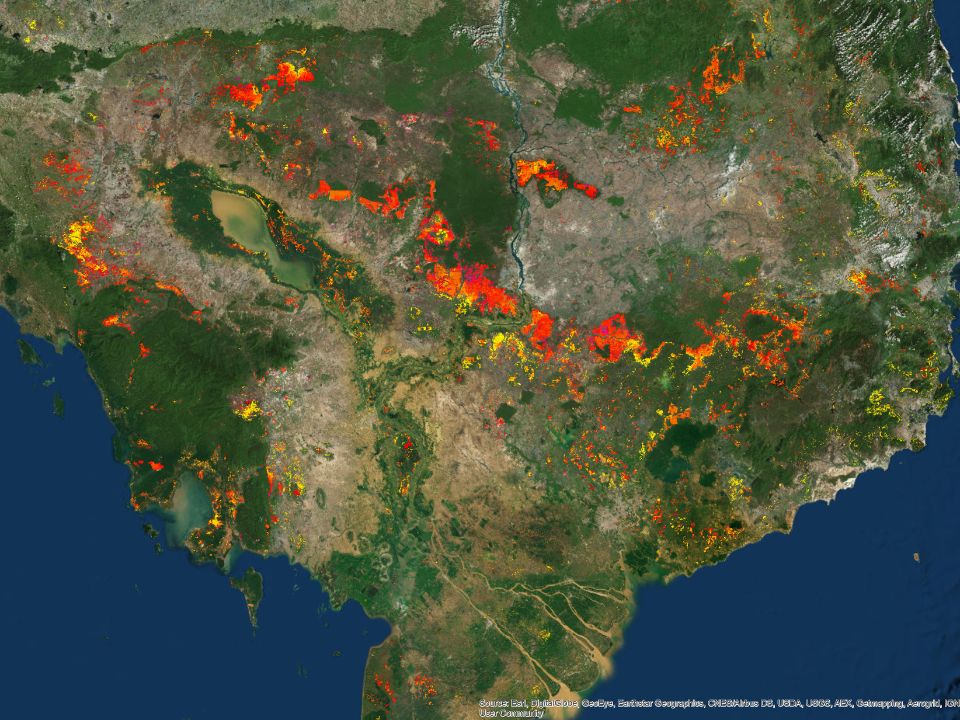

Globally more than 1 billion people depend on forests for their livelihoods. Forests play a crucial role in climate regulation, ecosystem services provision and regulation, water supply, carbon storage and many other functions that support biodiversity. Currently the global rate of deforestation is substantial, and there is a growing need for timely, spatially explicit data that flag natural vegetation changes due to human activities.
New deforestation hotspots point the finger at my favourite fruit I love Terra-i, but today I hate it. A lot. The system uses satellite images to track deforestation in the Amazon in near-realtime. It’s extremely accurate: if a bunch of trees come down somewhere – no matter how remote – Terra-i picks it up. Cool, right? Not today. CIAT’s Louis Reymondin, the system’s chief architect, dropped the bombshell over coffee: it looks as though hundreds of hectares of rainforest in Peru are being trashed by… papaya.

The latest update of Terra-i has been used with the Co$ting Nature ecosystem services assessment tool to understand the impacts of recent forest loss in Colombia on biodiversity and ecosystem services.
Ecuador is recognized as one of the biodiverse hotspots on earth, underneath the Amazon rainforest lies the country’s oil reservoir. With the oil companies and cleared routes come settlers, therefore more and more of this diverse rainforest is being cut down. Since the oil concerns entered the Ecuadorian Amazon 45 years ago, they keep exploring and exploiting the area. The Terra-i detections reveal a total habitat loss of 87,525 Ha, 16,943 Ha (19%) is part of protected areas, between January 2004 and February 2015.